
Courtney LaCaria
Housing & Homelessness Research Coordinator
Mecklenburg County Community Support Services
“Strange fascination, fascinating me
Ah, changes are taking
The pace I’m going through.”
These are lyrics from David Bowie’s song, “Changes,” which was originally released on the 1971 Hunky Dory album. Becoming one of his most popular songs of all time, pieces and parts of “Changes” have also appeared in films; been studied in classrooms; and used in all kinds of settings to represent (and unpack) the meaty concept of change. In fact, the song has also been used by those who have studied Bowie, deemed the “chameleon of rock” as a “manifesto of his entire career.” Out of context, this song is all about change; and it has come to mean (and give) different things to different people.
But, put into historical context, the meaning is given even more weight: the album in which “Changes” was released came at a time when Bowie was reinventing his artistic identity, in which those fascinations were setting the pace for what was to come, and which, ultimately, would define his career.
Similarly, this week’s blog is meant to outline some changes in how we communicate data about housing instability and homelessness, including through the Building Bridges Blog posts; Charlotte-Mecklenburg Housing & Homelessness Dashboard; and the 2022 State of Housing Instability and Homelessness Report. This post provides an overview of those changes, what any of this has to do with David Bowie, and what this can mean for Charlotte-Mecklenburg.
WHAT’S DIFFERENT, WHAT’S THE SAME, & WHY IT MATTERS
Integrated Data Reports
Changes? None. These annual reports are part of the Charlotte-Mecklenburg Housing Instability & Homelessness Report Series, which are funded by Mecklenburg County Community Support Services and completed by the UNC Charlotte Urban Institute.
Why It Matters. The reports integrate two or more data sources contained within the Institute for Social Capital’s database to describe homelessness using a different lens. For example, by integrating homelessness data in the Homeless Management Information System (HMIS) with educational data from Charlotte-Mecklenburg Schools (CMS), we can see how many children in CMS are also showing up in the HMIS database and vice versa, which can inform interventions. We completed this integration in 2016 (click the link to the Family Homelessness & Education report below) and uncovered a gap in services for school children experiencing homelessness in the shelter system. As a result of the report, CMS placed a McKinney-Vento liaison at Salvation Army Center of Hope’s emergency shelter. This year, we are pleased to share that the report will cover the intersection of homelessness and prevention.
Previous integrated data reports are accessible via the links below:
2022 State of Housing Instability & Homelessness Report (SoHIH)
Changes? Some. This annual report adopted its current format in 2018 as part of the Charlotte-Mecklenburg Housing & Homelessness Report Series (see above). Just as with the other integrated data reports, the SoHIH has been completed by the UNC Charlotte Urban Institute and funded by Mecklenburg County Community Supportive Services. Before 2018, the report solely focused on the numbers generated from the annual Point-in-Time Count.
Why It Matters. Since 2018, our community has had increased access to, and availability, of greater data on housing instability and homelessness; most importantly, we are putting the information to use. The SoHIH report now focuses on the full housing continuum: from the demand side of the equation, including housing instability to homelessness; to the supply side, including all shapes and forms of permanent, affordable housing. Mecklenburg County is grateful for the partnership with UNC Charlotte Urban Institute that has helped us grow this report from covering a one-night snapshot to an annual aggregator of local, regional, and national housing-related data; and for helping ensure its relevance for any stakeholder who needs information about and/or is engaged in the work to address housing instability and homelessness in Charlotte-Mecklenburg.
Beginning in 2022, the SoHIH report will be produced by Mecklenburg County Community Support Services. The report will look and feel different, but it will continue to aggregate data across the full housing continuum. This will include homelessness data sources like the Point-in-Time Count and Housing Inventory Count; System Performance Measures; and One Number, as well as data on housing instability and data on the affordable housing gap. In addition, the report will include new features, data, and content. Stay tuned for more details regarding these changes, including via the Building Bridges blog.
Building Bridges Blog
Changes? Some. Beginning with this blog post, the Building Bridges blog series will shift from a weekly cadence that covers an array of topics to two anchor posts per month. The anchor posts will be flanked by guest posts and other community updates as they are available or warranted.
Why It Matters. The Building Bridges blog series serves as the primary driver for traffic to the Dashboard. Blog posts have spotlighted different report releases; provided updates on community change efforts like the Charlotte-Mecklenburg Housing & Homelessness Strategy; shared examples of solutions from other communities for Charlotte-Mecklenburg to consider; and plunged into the minutia of policies, definitions, and data to help audiences understand and use all of this information for good. Each week the latest briefing is delivered to the inboxes of elected officials, community leaders, front-line staff, advocates, media outlets, faith community members, unaffiliated but interested residents, and individuals and organizations outside of Charlotte-Mecklenburg.
The blog post changes are intended to strengthen and expand the types of posts that are most relevant, based upon usage and engagement data. One of the new anchor posts will reflect the “state of the month” sharing the latest data on housing instability and homelessness (including the data featured on the Housing Data Snapshot). This post will also curate news and information about other events and/or pertinent changes within the realm of housing instability and homelessness. The second anchor post will take a deep(er) dive into different housing instability and homelessness topics. For the next 6 months, these posts will focus on content that will be included in the new 2022 SoHIH report.
And, last but, certainly not least: the Building Bridges blog series remains open to guest authors and other system-focused community updates. If you are interested in authoring and/or contributing to a future Building Bridges blog post, please email Courtney LaCaria at Courtney.LaCaria@mecknc.gov.
Charlotte-Mecklenburg Housing & Homelessness Dashboard
Changes? Always. First published by Mecklenburg County Community Support Services in 2017, the Dashboard has never stopped changing. And that’s intentional. The Dashboard was produced through a partnership with the UNC Charlotte Urban Institute; today, Mecklenburg County Community Support Services manages and maintains the online hub for local data on housing instability and homelessness.
Why It Matters. Since the very beginning, the Dashboard has added new content, research, and data. In fact, it has become the “go-to” space in the community to get the latest data: it is used by the public and private sectors for framing challenges around housing instability and homelessness; providing context to support information in board reports and grants; and raising awareness regarding both the issues and solutions. The Dashboard also maintains and updates the online presence for other system-focused efforts in the community, including Evaluate Upstream; Charlotte-Mecklenburg Housing & Homelessness Strategy and A Home for All Strategic Framework; Charlotte-Mecklenburg Continuum of Care; and EverybodyCountsCLT: Charlotte-Mecklenburg Point-in-Time Count.
Updates about the Building Bridges blog series, a core component of the Dashboard, are in the section above. Other changes to come include a design refresh of the research and data pages to make all the information easier to find (and ultimately, use); the addition of a news aggregator so that you can access housing related information, including from other communities; and new, interactive features to help connect the dots in new ways.
SO, WHAT
We are excited to share with you the fascinations that have been fascinating us: changes that are intended to help set the pace for the work ahead. At bottom, all these efforts are about connecting data with people so that they can use it for good. The first part of this effort is compiling, collating, synthesizing, analyzing, and sharing the information, itself.
The next step is actually applying the information to enact the necessary changes. Whether by informing policymaking; shaping funding; or driving programmatic change, this is where the people and the data intersect. While simple in concept, execution is not easy. It involves unraveling the knots of decades of discriminatory practices and policies, while laying a new foundation.
Creating a roadmap to uncharted territory, seeking the unknown, in the hopes of finding a way home for all, is what these changes are all about. This kind of change might seem strange (to us). By definition, change is strange.
Change, however, can lead to growth. To that end, Charlotte-Mecklenburg might do well to take a cue from Bowie and “face the strange,” as prescribed here in the closing lyrics of “Changes:”
“Ch-ch-ch-ch-changes (turn and face the strange)
Ch-ch-changes, oh, look out you rock ‘n rollers
Ch-ch-ch-ch-changes (turn and face the strange)
Ch-ch-changes, pretty soon now you’re gonna get older
Time may change me
But I can’t trace time
I said that time may change me
But I can’t trace time”
SIGN UP FOR BUILDING BRIDGES BLOG
Courtney LaCaria coordinates posts on the Building Bridges Blog. Courtney is the Housing & Homelessness Research Coordinator for Mecklenburg County Community Support Services. Courtney’s job is to connect data on housing instability, homelessness and affordable housing with stakeholders in the community so that they can use it to drive policy-making, funding allocation and programmatic change.

Number of People Homeless
ProgressHousing Instability
StoryHOUSING INSTABILITY IN CHARLOTTE-MECKLENBURG IS A GROWING PROBLEM. ITS IMPACT GOES BEYOND THE HOUSEHOLD – IT AFFECTS THE WHOLE COMMUNITY.
Millions of low-income households across the United States face housing instability and risk for homelessness because of their inability to afford housing costs. In 2014, 6.6 million low-income renter households experienced severe housing cost burden and 7 million low-income households were doubled up, living with friends or family.1 Many households make the decision to double up because they cannot afford housing costs independently.2 While families who experience housing instability may have a place to live, they often lack the financial and social resources to maintain existing housing or obtain subsequent safe and affordable housing if they lose their housing.3
People a day face housing instability at Crisis Assistance Ministry
Kushel and colleagues (2006) measured housing instability as difficulty paying rent or mortgage in the previous 12 months. By this measure, all persons who receive financial stability services at Crisis Assistance Ministry would be considered unstably housed.On average, 93 people a day facing housing instability seek assistance at Crisis Assistance Ministry, which equates to 15,143 families including 17,078 children each year (FY16). They are overwhelmingly African-American (83%) and women (60%) and have an average head of household age of 43 years old.
Customers at Crisis Assistance Ministries pay
Crisis Assistance Ministry provides 2.5 million dollars annually in rental assistance alone. The average family income of persons seeking assistance at Crisis Assistance Ministry is $1,295 monthly; the average household rent is $715 per month (55% of income) and average utility costs are $188 per month (14.6% of income). This means on average Crisis Assistance Ministry customers are paying 70% of their income toward housing costs.
Meet Lillie
When Lillie came to Crisis Assistance Ministry, she and her daughters were living out of suitcases in a pay-by-the-week hotel and eating from the dollar menu at McDonalds. Before being forced into the hotel, Lillie and her daughters were barely making ends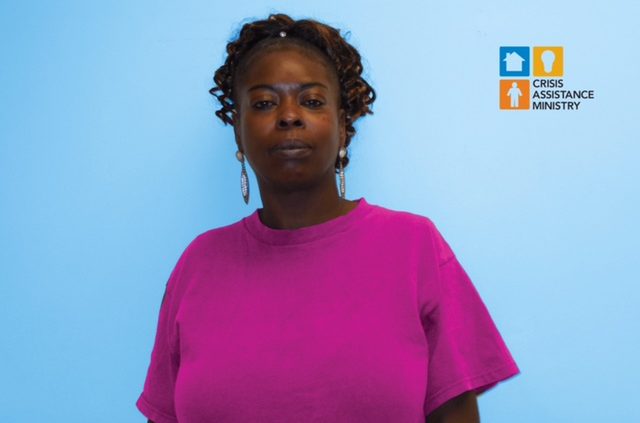 meet when their landlord sold the house they were renting and gave them 30 days to get out. Even before this emergency, Lillie’s life had not been easy. Years of barely getting by had negatively impacted Lillie’s health. Not yet 50, she had already suffered two heart attacks. Her 14-year-old daughter faces speech and development delays that require specific treatments. Without a permanent address, Lillie’s daughter could not receive the in-home medical care she needed.
The family found a new apartment, but they could not move in right away because they could not pay for the new deposits, first month’s rent, etc., all at once. Their savings had been exhausted on hotel and storage unit fees. Crisis Assistance Ministry assisted Lillie’s family with a partial rent payment to their new landlord which allowed them to move into their new apartment.
A household is considered moderately housing cost burdened if they spend 30%-50% of their gross income on housing costs; a household spending more than 50% of their income on housing costs is considered severely housing cost burdened.11,12 By these standards, on average, persons seeking assistance at Crisis Assistance Ministry are severely housing cost burdened and likely chronically unstably housed.
Moderate and severe housing cost-burden contributes to high rates of housing instability and eviction among low-income families but also forces families to make difficult decisions in relation to other basic needs and living conditions, as illustrated by Lillie’s story.11,13 Severely housing cost-burdened households spend 41% less on food each month, less on health care, and save less towards retirement.11
Housing instability has also been linked to poor child and adolescent outcomes including reduced academic performance and increased prevalence of social and behavioral problems.17,18
Meet The Johnsons
The Johnsons are a married couple with two young children, Mark and Sean. Mr. Johnson is employed as a carpenter, but his work hours have been lower than normal lately. When the rent and the electric bill were due at the same time earlier this month, Mr. Johnson was forced to make a choice. He paid the rent, but had no money left for the electric bill. When the disconnection notice from Duke Energy came in the mail, Mr. Johnson called and made a payment arrangement, thinking that surely he would get enough hours at work to pay the bill. But he didn’t, and the power was turned off. The Johnson family stayed in the home without electricity for two days because they didn’t want to ask for help.
When the weather got cold at night they went to stay with a family member and all slept on the living room floor for a week. It was very challenging to get their 6-year-old to school each morning. He normally rides the school bus. Since they were staying out of their neighborhood, they had to find an alternate way to get him to school. He had to miss a few days because they couldn’t find a ride. Crisis Assistance Ministry assisted the Johnson family by making a direct payment to Duke Energy for their past due electric bill. Since the electricity was restored, the family could move back into their home and Sean could return to his regular routine of taking the bus to school.
Race-based and gender-based discriminatory housing practices and forced relocation or eviction are experienced disproportionately by low-income Black and African American women and contribute to housing instability among minority- and female-led households.15, 20-23 Risk profiles for housing instability vary by income, age, interaction with public assistance, and homeownership.24 The costs of housing instability are not limited to individual households, but also impact government and charitable programs that are ultimately needed to support unstably housed families.11 Risk factors and risk profiles for housing instability are important considerations for service providers and policymakers when considering target populations for funding, programming components, and points of intervention.
Crisis Assistance Ministry is the Lead Agency offering financial assistance and fostering financial stability and economic mobility for impoverished families in Mecklenburg County. Specifically, Crisis Assistance Ministry prevents homelessness, preserves dignity, and assists struggling families as they work toward financial stability by: addressing their immediate crisis with emergency rent and utility assistance; providing free clothing, household goods, furniture and appliances allowing families to divert those funds towards household costs; providing counseling, services and support to give families the tools they need to achieve economic mobility; and educating the community about the realities of poverty in Mecklenburg County.
Visit them online at www.crisisassistance.org or www.facebook.com/crisisassistance.
References