
Since its inception in 2019 , the “One Number” has served as the primary benchmark for the number of people experiencing homelessness in Charlotte-Mecklenburg. It provides the best available snapshot of people actively experiencing homelessness and offers critical insight into the minimum number of housing units and subsidies needed today to address that need. The One Number also tracks how people flow into and out of the homeless services system over time.
CAYCE JAMIL, Ph.D.
Senior Management Analyst – Homelessness and Housing Research Coordinator
Mecklenburg County Community Support Services
On July 23, 2026, the National Low Income Housing Coalition (NLIHC) released their latest Out of Reach 2026: The High Cost of Housing report. This annual report highlights the mismatch that exists between individuals’ wages and housing prices nationally, at the state level, and in every metropolitan area in the country.
The report revolves around their central statistic, the Housing Wage, which estimates how much it would cost a full-time wage earner to rent a home at the US Department of Housing and Urban Development’s (HUD) Fair Market Rate (FMR) without spending more than 30% of their income on rent and utilities combined.
Key Takeaways
Comparing Housing Wages Nationally and Regionally
Overall, the report shows that the average renter in the US is unable to afford a 1-bedroom unit without being cost-burdened. A household is considered cost-burdened when they spend more than 30% of their income on their rent or mortgage, combined with utilities.
As shown in the table below, at the national level, a single full-time wage earner needs to earn $29.19 per hour to afford a one-bedroom rental unit at their Housing Wage, and $34.73 per hour to afford a two-bedroom rental unit at their Housing Wage. This is similar to the rates in the Charlotte-Concord-Gastonia Area, which are slightly higher for a one-bedroom and slightly lower for a two-bedroom (see table 1 below).
Table 1: Comparing Housing Wages Nationally, in North Carolina, and in Charlotte Metropolitan Area
National |
North Carolina |
Charlotte Metropolitan Area |
|
1-Bedroom Housing Wage |
$29.19 |
$23.93 |
$29.58 |
2-Bedroom Housing Wage |
$34.73 |
$27.11 |
$32.42 |
Changes in Fair Market Rents for the Charlotte Metropolitan Area
Notably, these rates are slightly lower for the Charlotte Metropolitan Area compared to last year, which was $31.67 for a 1-bedroom housing wage, and $35.08 for a 2-bedroom housing wage. This occurred because the FMR for the Charlotte Metropolitan Area was set lower than the previous year. The FMR is set based on recent movers in the 40th percentile of gross rentals in the American Community Survey, which was estimated to be slightly lower than the previous year. Therefore, the FMR for a 1-bedroom unit in the Charlotte Metropolitan Area is now $1,538 per month (down from $1,647 per month in 2025) and for a 2-bedroom is now $1,686 per month (down from $1,824 per month in 2025).
Table 2: Fair Market Rent Rates for the Charlotte Metropolitan Area by Fiscal Year
Year |
Efficiency |
1 Bedroom |
2 Bedroom |
3 Bedroom |
4 Bedroom |
FY 2024 |
$1,347 |
$1,384 |
$1,554 |
$1,936 |
$2,481 |
FY 2025 |
$1,586 |
$1,647 |
$1,824 |
$2,250 |
$2,852 |
FY 2026 |
$1,469 |
$1,538 |
$1,686 |
$2,076 |
$2,637 |
National Wage Gaps and Affordability Challenges
At the national level, these numbers are concerning as the average hourly wage of renters nationally is $24.84, which is $4.35 per hour less than what is needed to afford a one-bedroom and $9.89 per hour less than what is needed to afford a two-bedroom at their Housing Wage. Roughly 60% of all full-time wage earners nationally cannot afford to rent a one-bedroom unit at the Housing Wage.
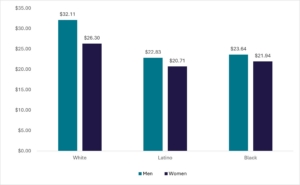
Moreover, as shown in the figure below, at the national level, there are significant disparities in hourly wage related to race, ethnicity, and gender. While the median wage of full-time White male workers ($32.11) is enough to afford the one-bedroom housing wage, all other demographics in the report fall short of this threshold.
Figure 1: National Median Wages by Race and Gender
Regional Snapshot: Mecklenburg County and the Charlotte Metro Area
Summarizing the data for the region, in Mecklenburg County 44% of the 466,527 households were identified as renters, and in the Charlotte Metropolitan region, of which Mecklenburg County is one portion of, 38% of the 728,586 households were identified as renters. Compared to the national level, the region paints a slightly more optimistic picture. In Mecklenburg County the average hourly wage of renters is $32.23 (roughly $67,050 a year), which can cover a 1-bedroom housing wage in the area, and almost a 2-bedroom housing wage. In the Charlotte Metropolitan Area, the average hourly wage of renters is $29.18 (roughly $60,695 a year), which is just below a 1-bedroom housing wage. The average wage of renters has also increased since last year, which was $30.97 (roughly $64,500 a year) in Mecklenburg County, and $27.81 (roughly $57,850 a year) in the Charlotte Metropolitan Area.
The annual median income (AMI) of households for the Charlotte Metropolitan Area, which includes both homeowners and renters, is $117,400. In comparison, the median renter household income is $65,834, which is very close to the mean AMI of renters (roughly $67,050), and can afford a one-bedroom at the Housing Wage.
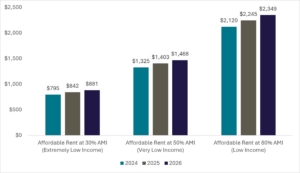
Next, focusing on the AMI of households, 80% of this figure is considered by the HUD to be low income, 50% is considered very low, and 30% is considered to be extremely low income. Low income in the Charlotte Metropolitan Area, which is 80% of the AMI, is $93,920 a year. This salary can afford a one- or two-bedroom unit at FMR and could even afford a three-bedroom unit at FMR, which is $2,076 per month. However, a very low income, which is 50% of the AMI, is $58,700 and cannot afford a one-bedroom at the Housing Wage. Similarly, 30% of the AMI, which is considered an extremely low-income for an area, is $35,220, and also cannot afford a one-bedroom at the Housing Wage. The chart below shows affordable rents for each of these household incomes over the last three years.
Figure 2: Affordable Rent in Charlotte Metropolitan Area by Income
The report also highlights the minimum wage. North Carolina is one of twenty states that still rely on the federal minimum wage of $7.25 per hour. For someone working a minimum wage job to afford a one-bedroom unit at FMR in the Charlotte Metropolitan Area, they would need to work 156 hours a week. As a reminder, a week is comprised of 168 hours. In other words, an individual would need to work just over 4 full-time jobs at minimum wage to afford a one-bedroom unit at FMR. Notably though, Mecklenburg County Government, the City of Charlotte Government and the Charlotte-Mecklenburg School District all pay employees above the Federal minimum wage. The minimum wages for each are $25.53 per hour, $25 per hour, and $20 per hour, respectively.
Conclusion
The Out of Reach 2026 report shows that, across the nation, the average renter is cost-burdened by housing. In the Charlotte Metropolitan Area, primarily due to a lower Fair Market Rent metric this year set by the HUD, renters appear to be slightly less cost-burdened compared to the rest of the nation. Indeed, with a dip in rental rates and an increase in wages, renters in the Charlotte Metropolitan Area appear to be doing better in comparison to the previous year.
However, with that said, the HUD has already released the FMR rates for FY 2027, and for the Charlotte Metropolitan Area, they increase from FY 2026 to rates very similar to FY 2025. Therefore, although this year’s Out of Reach appears optimistic due to the drop in FMRs, this is likely an anomaly rather than a new norm. The number of households that are cost-burdened has increased across the nation, and, except for this fiscal year, the Charlotte Metropolitan Area has followed this trend. As a reminder, cost-burdened households face higher risks of eviction, displacement, and homelessness. Continued investments, like through the Charlotte Housing Trust and Ascent Housing, are crucially needed to mitigate these tendencies in the region.
In September 2025, professionals in Mecklenburg County working in youth-oriented spaces came together to embark on the 100-Day Challenge to End Youth Homelessness. Multiple organizations, including members of the Mecklenburg County Continuum of Care and the Youth Action Board, were able to share expertise with one another to develop creative solutions for youth homelessness in the community.
This blog provides an explanation of the 100 Day Challenge, the goal and results of the challenge, and next steps following the end of the challenge.
Last month, the National Alliance to End Homelessness (NAEH) and the Corporation for Supportive Housing (CSH) released Building a Stronger Future for Supportive Housing: Lessons Learned from Nationwide Community Conversations, a new report examining what communities across the country are learning about the strengths, challenges, and future of supportive housing.
This blog provides an overview of the report, key findings, and what they might mean for Charlotte-Mecklenburg.
In March, the National Low Income Housing Coalition released The Gap: A Shortage of Affordable Homes, its annual report examining the availability of rental housing affordable to the lowest-income households in the United States.
This blog provides an overview of the report, key findings, and what they might mean for Charlotte-Mecklenburg.
Each year, communities across the country come together to complete the annual Point-in-Time (PIT) Count, a federally required census of people experiencing homelessness on a single night. In Charlotte-Mecklenburg, the PIT Count serves as more than a compliance exercise. It is one of the most important tools we have to understand who is experiencing homelessness in our community, how homelessness is changing over time, and where our system must continue to evolve.
This blog highlights key findings from the 2026 Point-in-Time Count and explores what the data tell us about homelessness trends, emerging needs, and system performance in Charlotte-Mecklenburg.
Since its inception in 2019, the One Number has served as the primary benchmark for understanding the number of people experiencing homelessness in Charlotte-Mecklenburg. It provides the best available snapshot of people actively experiencing homelessness and offers critical insight into the minimum number of housing units and subsidies needed today to address that need. The One Number also tracks how people flow into and out of the homeless services system over time.
This week’s blog provides the most recent One Number update, key trends and analysis, and what the latest data mean for Charlotte-Mecklenburg.
Housing instability, homelessness, and stable housing represent interconnected stages along a single housing continuum. Each stage reflects whether households are able to obtain and maintain safe, affordable, and sustainable housing over time. Understanding how households move along this continuum helps clarify both the causes of housing instability and homelessness and the solutions required to improve housing stability.
This blog is the fifth and final post in a five-part series examining findings from the 2025 State of Housing Instability and Homelessness (SOHIH) Report. This post brings together key findings from across the housing continuum and examines what these findings reveal about housing stability and housing access in Charlotte-Mecklenburg.
Stable housing represents the endpoint of the housing continuum and the foundation for long-term housing stability. While housing instability reflects households at risk of losing housing and homelessness reflects households who have already lost housing, stable housing ensures households can maintain safe, affordable, and sustainable housing over time.
This blog is the fourth in a five-part series examining findings from the 2025 State of Housing Instability and Homelessness (SOHIH) Report. This post takes a closer look at stable housing in Charlotte-Mecklenburg, including the role of permanent housing and rental assistance in helping households exit homelessness and maintain long-term housing stability.
Homelessness represents one of the most visible and severe forms of housing instability. While housing instability reflects households at risk of losing housing, homelessness occurs when households lose access to safe, stable, and sustainable housing entirely. Understanding homelessness requires examining both how households enter homelessness and how quickly they are able to exit into permanent housing.
This blog is the third in a five-part series examining findings from the 2025 State of Housing Instability and Homelessness (SOHIH) Report. This post takes a deeper look at homelessness in Charlotte-Mecklenburg, including how many households experience homelessness, how long households remain homeless, and how access to permanent housing influences homelessness outcomes.