Courtney LaCaria
Housing & Homelessness Research Coordinator
Mecklenburg County Community Support Services
What is the definition of homelessness? Who is included? Who is not? Who gets to decide? What about housing instability? Do we have the full picture? Does that even matter? What are the implications of exclusive definitions?
The July 2021 One Number Update shared the news regarding the Building Bridges blog transition from a singular focus on the One Number to a new, more comprehensive data update. This new approach will attempt to cover the full housing continuum, from housing instability to homelessness. Even with the progress made to enumerate homelessness using the One Number (which includes sheltered and a portion of unsheltered homelessness), there are still many households who experience housing instability and homelessness that are not captured. It is critical to identify the households “in the gap” to understand both the need for services and to construct effective solutions to address these needs.
An important outcome of the Charlotte-Mecklenburg Housing & Homelessness Strategy is to identify and close the remaining gaps in data collection and reporting across the full housing continuum. This week’s blog will frame the current state of data from a demand-side viewpoint: the number and characteristics of people experiencing housing instability and homelessness as well as from the supply-side lens: the capacity of the system to both temporarily shelter and permanently house individuals and families in the community.
Aligning Data across the Housing Continuum
Enumerating both the number of people who need housing assistance and the inventory to meet those needs, across the housing continuum, is complicated. While there are some system-focused data collection tools like the Housing Management and Information System (HMIS), which include multiple housing and homeless providers, overall housing continuum input data is fragmented. The reasons for this fragmentation are as varied as the fragments, themselves.
For example, there are many different definitions of homelessness; these definitions vary by the funding source or oversight body. The definition of homelessness set by the U.S. Department of Housing & Urban Development (HUD) for the Point-in-time Count is much narrower than the definition employed by the U.S. Department of Education to determine eligibility for McKinney-Vento services for students. Further, the Point-in-Time Count is a one-night snapshot reported annually, whereas the number of students experiencing homelessness and who are eligible for McKinney-Vento services is a cumulative total across twelve months.
This means that the reporting of data across the housing continuum is also fragmented. Programs serve populations who fall in different places along the homelessness continuum. Having different definitions is not the problem. In fact, the definition of homelessness used by the Charlotte-Mecklenburg Housing & Homelessness Strategy is intentionally broad and inclusive of existing definitions (see below). Definition alignment, however, is not enough in and of itself. Without a standardized intake assessment and data collection process for everyone on the full housing continuum, and without a single mechanism to aggregate and de-duplicate data collected, it is difficult (if not impossible) to look at all housing and homelessness data at a systems level.
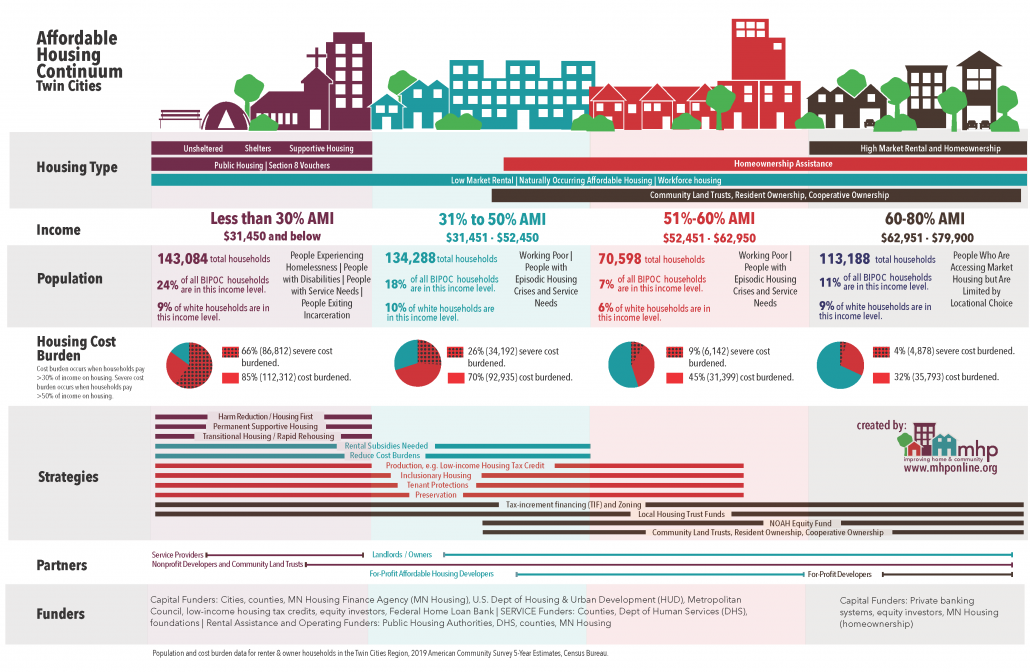
This is not a situation that is specific to Charlotte-Mecklenburg. There is no other community that has developed a way to share this level of data across the full housing continuum. However, some communities have attempted to knit the pieces of the housing continuum together. A helpful example is the Minnesota Housing Partnership’s (MHP) Housing Continuum. In 2018, MHP developed an infographic (depicted below) to illustrate their housing continuum. The infographic is organized by level of Area Median Income (AMI), and includes types of housing resources; housing cost burden; number and demographics of households; and strategies, partners, and funders who support households.
Housing Continuum Components
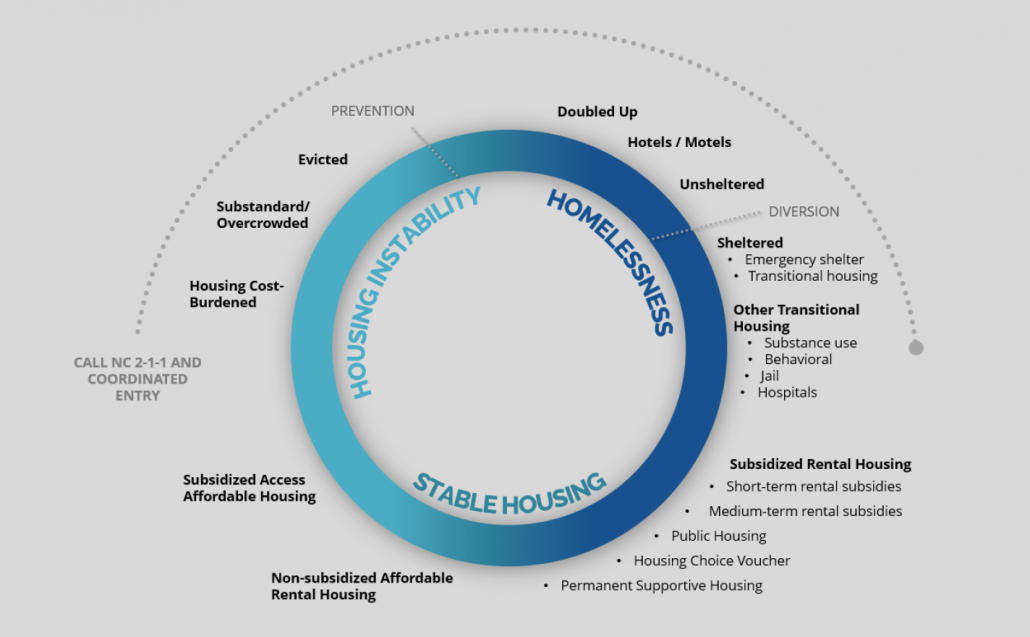
The graphic depicted below helps visualize the relationship of all the components that comprise the full housing continuum. What is included in housing instability? Homelessness? Permanent, affordable housing? In addition, this graphic provides a helpful frame to organize what we know (available data and related sources) and what we don’t know (gaps and/or organizational-level-only data).
Provided below are definitions for each of the three main components of the housing continuum.
Housing Instability
Housing Instability is a type of housing status that exists along the housing instability and homelessness continuum. Housing instability can occur when an individual or household experiences any of the following: living in overcrowded and/or substandard housing; difficulty paying rent or mortgage; experiencing frequent moves due to economic or affordability reasons; doubling up with family or friends; or living in hotels. Cost-burden is frequently used as a measure of housing instability. Many people who become homeless have faced housing instability.
Homelessness
Homelessness is a type of housing status that exists along the housing instability & homelessness continuum. Homelessness, by definition, means the loss of housing. Homelessness can occur when a household lacks a fixed, regular, and adequate nighttime residence. This can include doubling up with family and/or friends; paying to stay week to week in hotels/motels; temporarily residing in a shelter and/or transitional housing facility; experiencing unsheltered homelessness; exiting an institutional setting within a set period of time after previously experiencing homelessness; and/or fleeing domestic violence. The definition of homelessness employed varies by funding source.
Permanent, Affordable Housing
Housing is considered affordable if a household does not have to spend more than 30% of their pre-tax gross annual income on housing-related expenses (rent/mortgage and utilities). Generally, the term “affordable housing” is applied to households with annual income between 0% and 120% of Area Median Income (AMI). There are three primary considerations related to ensuring an inventory of permanent, affordable housing: preserving existing units and resources; adding new units and resources; and removing barriers to available units and resources, such as Source of Income Discrimination (SOID). Preserving existing housing stock includes the retention of Naturally Occurring Affordable Housing (NOAH) and other lower-cost rental inventories, as well as the rental subsidies needed to gap the difference in cost and affordability. Therefore, ensuring adequate levels of permanent, affordable housing means both the physical units, themselves; and the financial assistance used to gap the difference between what housing costs and what households can afford. Examples of financial assistance include short-term rental subsidies, such as rapid re-housing; as well as long-term subsidies and/or vouchers, like permanent supportive housing and Housing Choice Vouchers.
Next Steps
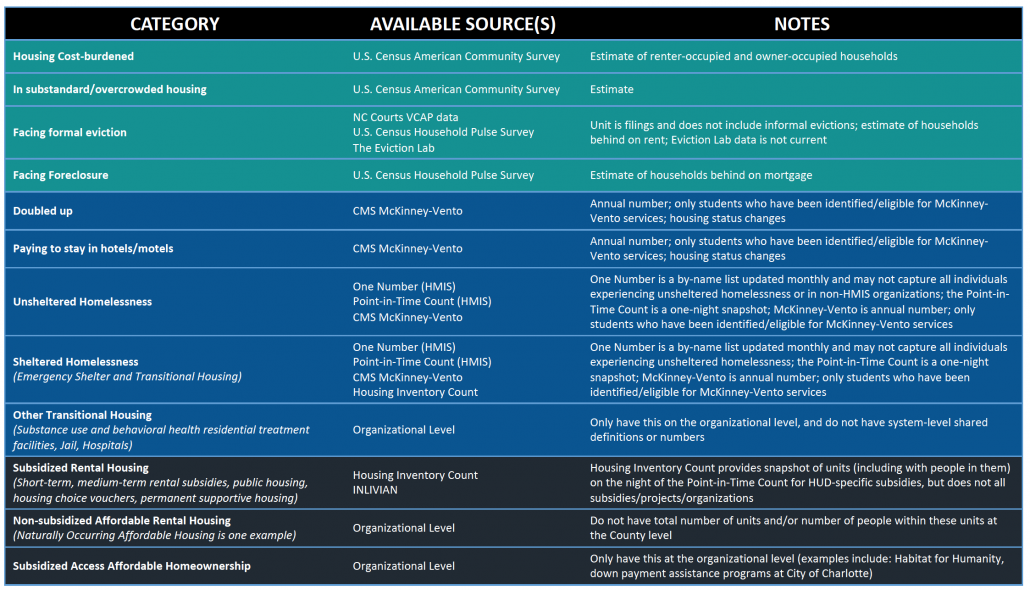
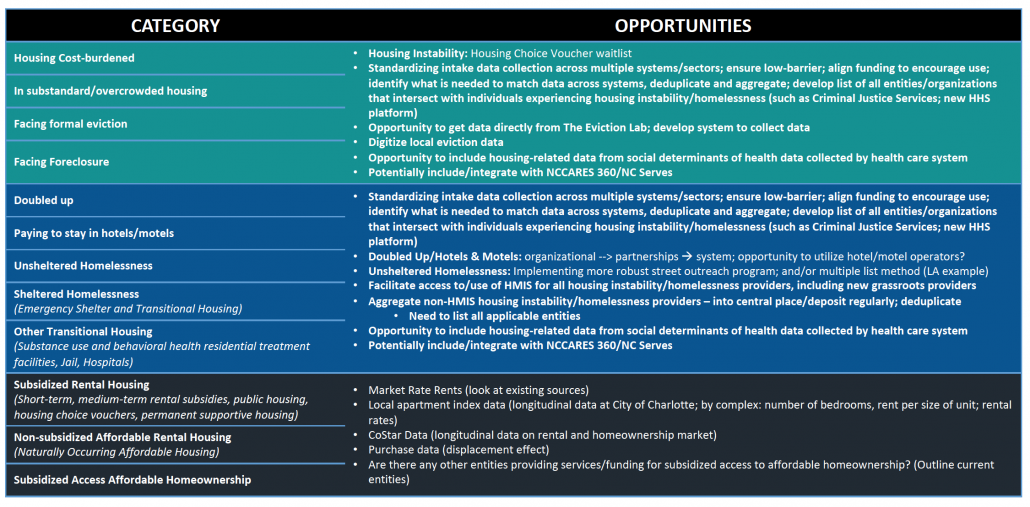
The tables below, which reflect work from the data-focused workstream of the Charlotte-Mecklenburg Housing and Homelessness Strategy, take the components from the housing continuum and highlight existing data (with available sources) as well as opportunities for closing the data gap and increasing alignment.
So, What
Peter M. Senge, an organizational learning expert and lecturer, is famously quoted for saying, “Dividing an elephant in half does not produce two small elephants.” This statement can also be applied to how we view data: not as small, unrelated parts, but holistically and as a system.
Parsing the problem, narrowing the scope, or prioritizing specific populations experiencing housing instability or homelessness cannot address the full problem. A limited view might seem to cost less at first but failing to address the problem comprehensively will likely be more expensive to a community in the long run. And a fragmented approach, in addition to creating fragmented information, only serves to separate; further, it creates a competitive environment wherein people in need and providers are jockeying for limited resources. Instead, we should strive to create an inclusive system that can work collaboratively for everyone.
It is, therefore, essential that communities, like Charlotte-Mecklenburg, have the fullest possible picture to quantify need, estimate cost, secure funding, implement solutions, and evaluate results. Future housing and homelessness data-focused posts will share available data updates, as well as progress updates on the work to close the gaps.
SIGN UP FOR BUILDING BRIDGES BLOG
Courtney LaCaria coordinates posts on the Building Bridges Blog. Courtney is the Housing & Homelessness Research Coordinator for Mecklenburg County Community Support Services. Courtney’s job is to connect data on housing instability, homelessness and affordable housing with stakeholders in the community so that they can use it to drive policy-making, funding allocation and programmatic change.


