Analyzing Returns to Homelessness:
Insights from Stella P for Charlotte-Mecklenburg
Mary Ann Priester
Senior Management Analyst
Mecklenburg County Community Support Services
Stella, developed by the Department of Housing and Urban Development (HUD), serves as an analytical and strategic tool for Continuums of Care (CoCs) to examine the dynamics of their homeless services system performance. The Stella Performance Module (Stella P) visualizes a homeless system’s performance using the CoC’s Longitudinal System Analysis (LSA) data. Stella P empowers communities to develop and monitor strategies to improve system performance. This blog is the fourth installment in a series of blogs examining Charlotte-Mecklenburg’s latest LSA data utilizing the Stella P Module.
This blog provides an overview of returns to homeless, local performance on this metric, and highlights opportunities for performance improvement within the Charlotte-Mecklenburg homeless services system.
STELLA P
Stella P is used to visualize a CoC’s Longitudinal System Analysis (LSA) data. It consists of five sections: Dashboard, Days Homeless, Exits, Returns, and Demographics.
Dashboard: Provides an overview of the number of households and people served and a performance overview; trends over the past 3 years; and a system performance map.
Days Homeless, Exits, Returns: Reviews system level performance for number of days homeless, permanent housing exits from the homeless system, and returns to homelessness after exits to a permanent destination. Each measure can be examined by pathway (combination of projects types a household uses when moving through the homelessness system), population group, and race and ethnicity.
Demographics: Provides an overview of demographic characteristics for households and individuals served by household type and project type and a comparison of demographic characteristics by project type.
Previous blogs provided an overview of LSA data and the Stella P dashboard and system performance map, system exits, and days homeless. This blog focuses on returns to homelessness.
RETURNS TO HOMELESSNESS
The Stella P Returns to Homelessness module consists of four components: Returns to Homelessness Overview, Returns to Homelessness by Pathway, Returns to Homelessness by Population Group, and Returns to Homelessness by Race and Ethnicity. This blog will examine the first three. A future blog will focus on how Stella P can be used to assess system performance by race and ethnicity.
For the Longitudinal Systems Analysis (LSA), a return to homelessness is defined as an enrollment in emergency shelter, safe haven, transitional housing or permanent housing types: rapid rehousing and permanent supportive housing projects that enter data in the Homeless Management Information System (HMIS) after exiting the homeless services system. At this time, the LSA does not include data from street outreach or coordinated entry projects and thus this metric excludes people who have returned to homelessness and may be experiencing unsheltered homelessness or do not enroll in an emergency shelter, safe haven, transitional housing, rapid rehousing, or permanent supportive housing project that enters data in HMIS. The key performance measures for returns to homelessness are the number of households that return to homelessness within 6 months, 12 months, and 12 to 24 months after exiting to a permanent destination. The 6-month time frame represents households that exited within the first 6 months of the reporting time frame, in this case 10/1/22 – 4/1/23. The 12-month time frame is households that exited in the 12 months prior to the reporting period, in this case 10/1/21 – 9/30/22. The 12 – 24-month time frame includes households that exited between 12 and 24 months prior to the start of the reporting period, 10/1/20 – 9/30/22. Stella P also provides an analysis of what are referred to as re-engagers. These are households that exited to a temporary or unknown destination within the same time frames.
The Returns to Homelessness Overview page shows an overview of these metrics by household type, the time distribution of returns by household type, and trends in returns by household, population group, and destination type.
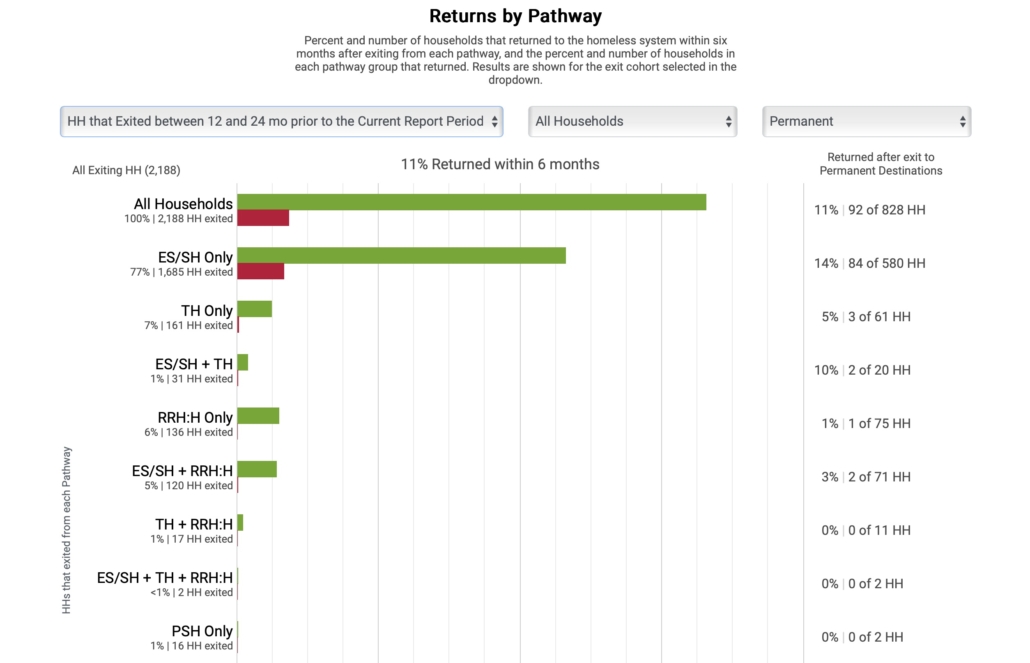
The Returns to Homelessness by Pathway page shows returns by the combination of projects that a household was served in during prior experience in the homeless services system. For example, if a household’s last exit before returning to homelessness was from a pathway that included transitional housing only, they would be included in the transitional housing only pathway.
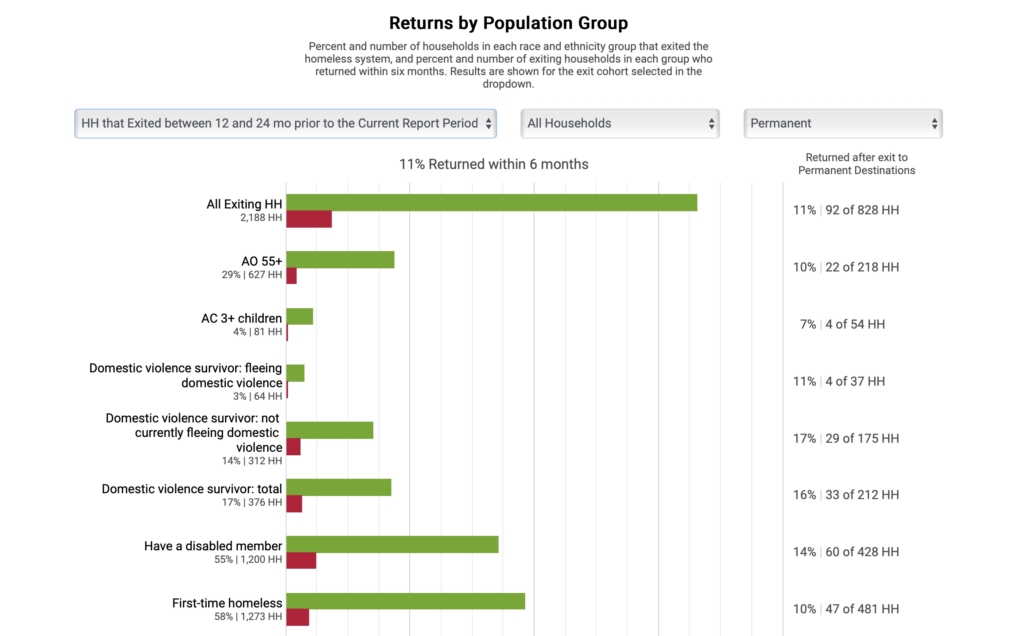
The Returns to Homelessness by Population Group page shows the percentage and number of each population group that returned to homelessness. Both the Returns to Homelessness by Pathway and Returns to Homelessness by Population Group pages can be used to drill down to specific household and destination types.
CHARLOTTE-MECKLENBURG RETURNS TO HOMELESSNESS
Overview
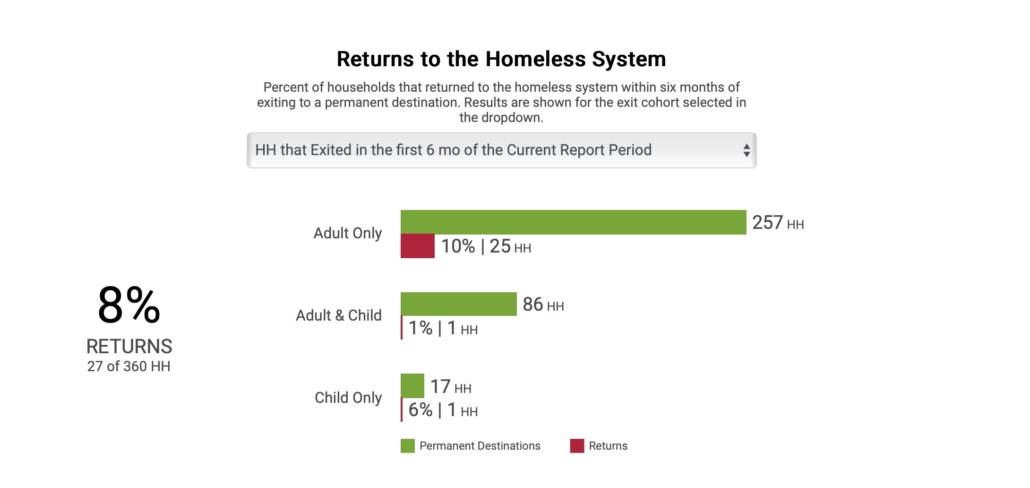
The Charlotte-Mecklenburg Returns to Homelessness Overview module shows that the cumulative percentage of returns within 6 months of exiting to a permanent destination across all household types is 8%. Adult only households had the highest rate of returns (10%) while adult-child households had only 1% return within 6 months of permanent housing exit. When looking at the 12-month timeframe, the cumulative number of returns was 12% with 14% of adult only households returning and 8% of adult child households returning. Within the 12–24-month time frame, overall 11% of households returned to homelessness with 13% of adult only households returning and 5% of adult child households returning.
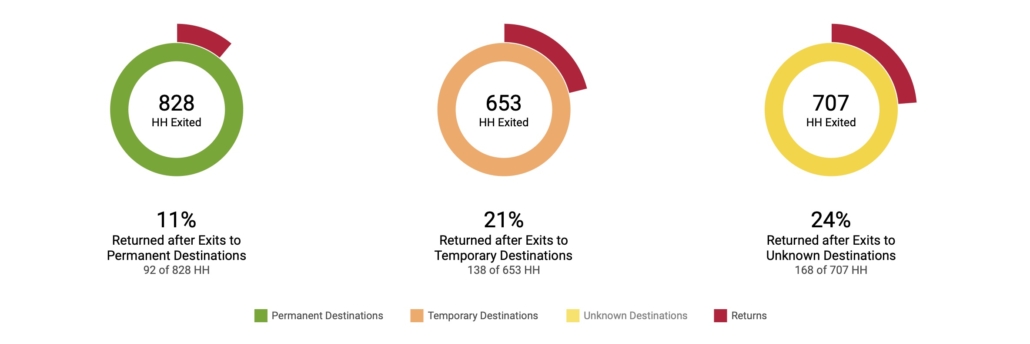
When reviewing the time distribution of returns, the highest percentage of households returned between 181 and 365 days with 6% of adult only households returning during this time period and 7% of adult-child households returning during this time period. When reviewing households that exited to temporary destinations and then returned or re-engaged with the system, over the past three years between 18% and 21% return within 6 months. We see a similar trend over the past three years for those exiting to unknown destinations. Between 16% and 24% re-engage within 6 months of exit.
By Pathway
The Charlotte-Mecklenburg Returns by Pathway module shows the highest percentage of returns are observed with the emergency shelter/ safe haven only pathway. Within 6 months of exit to a permanent destination, 10% of households return, within 12 months, 14% return, and between 12 and 24 months, 14% return. We also see the highest percentage of returns from temporary exits within the emergency shelter/ safe haven only pathway with 27% returning in 6 months, 25% in 12 months, and 26% between 12 and 24 months. This trend is consistent for adult only households. However, when we drill down to adult-child households, we do see some variation. The highest percentage of returns from permanent housing for adult-child households within 6 months are observed in the rapid rehousing only pathway (7%), within 12 months, the highest percentage is the emergency shelter/ rapid rehousing pathway (14%), and between 12 and 24 months, we see the highest rates of returns from the emergency shelter/ safe haven only pathway (7%).
By Population Type
The Returns to Homelessness by Population Group chart shows that of the population types featured, adult only households consisting of people who report being survivors of domestic violence (not fleeing) have the highest percentage of returns from permanent housing within 6 months (18%). Within 12 months, the population with the highest rate of returns from a permanent destination is households with a disabled family member (16%). In the 12–24-month range, the population with the highest rate of returns from permanent housing is survivors of domestic violence (not fleeing; 24%). The data also illustrate that across population types, household types, and time frames, those who exit to temporary or unknown destinations return to homelessness at higher rates than those who exit to permanent destinations.
OPPORTUNITIES FOR IMPROVEMENT
Based upon the data provided in Stella P Returns to Homelessness module, between 6 and 12 months post permanent exit is a critical time period where interventions could be targeted to ensure housing stability. These data also suggest that there may be opportunities for intervention improvements for adult-child households enrolled in the emergency shelter/ rapid rehousing pathway to ensure these households are able to maintain housing stability post-exit from their rapid rehousing programs. The analysis of returns by population types highlights the increased risk for survivors of domestic violence who are not fleeing in returns to homelessness post permanent exit. These returns could potentially be prevented by ensuring better connection to domestic violence supports and services prior to system exit and the need to ensure households are connected to ongoing care and services post-exit if needed. Finally, these data indicate that when households exit to a permanent destination, their likelihood of returning to homelessness is decreased. Additional permanent housing and supportive resources are needed to decrease the number of households exiting to temporary destinations and to ensure homelessness does not recur for households when they exit the system.
SO WHY DOES THIS MATTER?
Stella P facilitates the system analysis necessary to create actionable strategy to improve the local homeless services system. Stella P’s Returns to Homelessness module provide important insights into which pathways and populations could be targeted to homelessness is non-recurring in Mecklenburg County. These data highlight important considerations as our community makes decisions about resource allocation and alignment to ensure homelessness is rare, brief, and non-recurring in Charlotte-Mecklenburg.


